The Analytics and Insights section helps store owners make informed business decisions by tracking key sales metrics and product performance. This area is designed to help you understand what’s working, identify trends, and optimize your selling strategy based on real data — not guesswork.
It is divided into two parts:
- Sales Report
- Product Performance
Sales Report
This screen gives you a complete overview of your store’s performance over a custom date range.
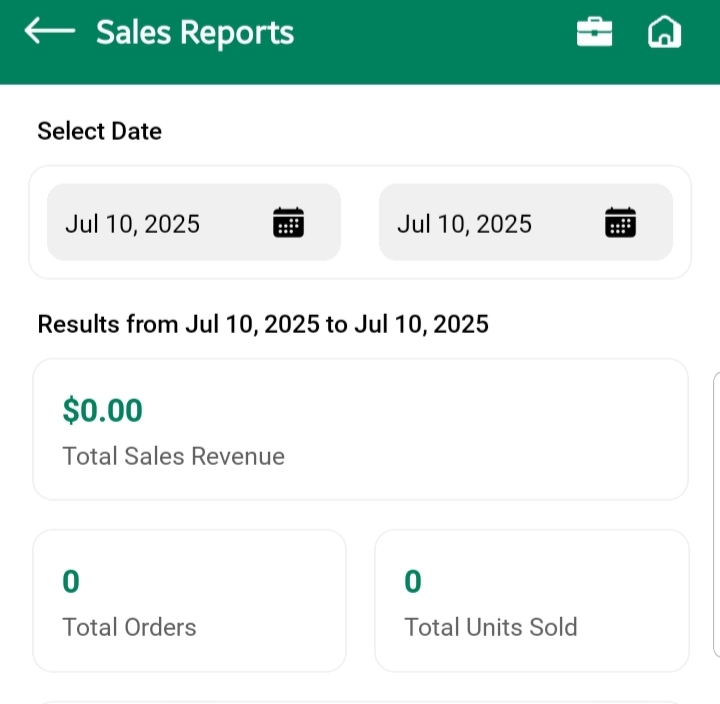
Date Filters
Use the Starting Date and Ending Date dropdowns to select any period you want to analyze — weekly, monthly, seasonal, or custom.
📌 Why it matters: You’re in control of the reporting window. Filter data to match your campaigns, launches, or promotional periods.
Key Metrics Breakdown
Once the date range is selected, the following performance cards are shown:
- Total Sales Revenue
Shows the total income generated from all orders during the selected period.
Helps you assess overall business growth. - Total Orders
Displays the number of orders placed — a direct indicator of store activity. - Total Units Sold
Reflects the quantity of individual items sold, not just total orders.
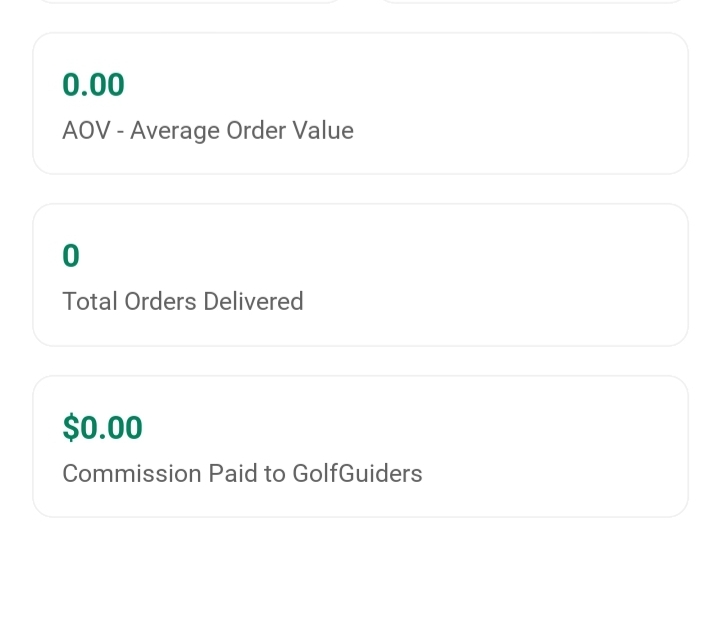
Useful for understanding product volume movement. - AOV (Average Order Value)
Shows the average value of each order placed.
Useful for tracking how much customers are spending per transaction. - Total Orders Delivered
Represents how many of those orders were successfully delivered — critical for fulfillment performance. - Commission Paid to GolfGuiders
Shows the platform fee or cut taken from your sales, helping you track net earnings more accurately.
📈 Pro Tip: Monitor AOV and Total Orders together — if orders are high but AOV is low, consider upselling or bundling products to increase order value.
Product Performance
This section answers a key business question:
“Which products are performing best?”
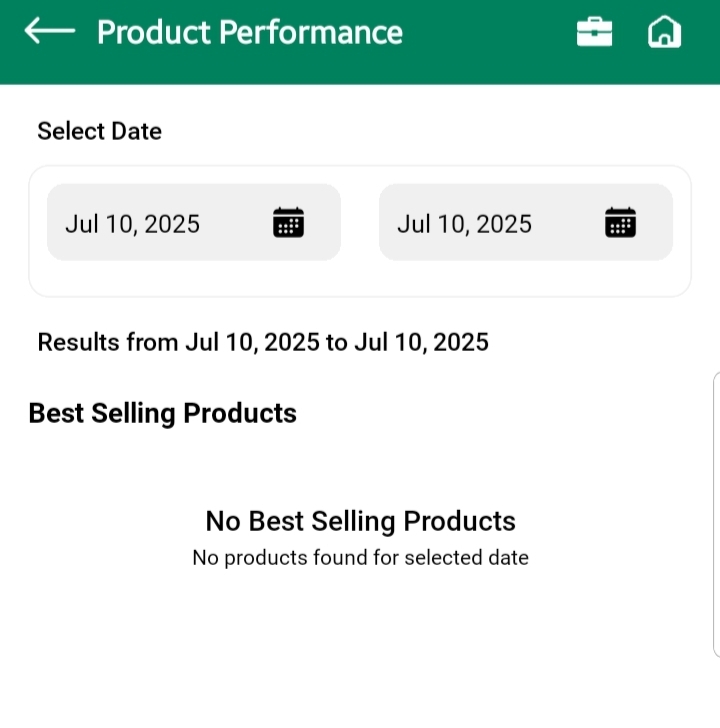
Date Filters
Just like Sales Report, this screen also allows you to filter data using Starting Date and Ending Date dropdowns.
Set the timeframe for which you want to analyze product sales — whether it’s for a sale period, festival season, or a regular week.
Products Listing
Below the date filters, you’ll see a ranked list of product cards showing your top-selling items based on quantity sold.
Each card provides insight into:
- What your customers are buying most
- Which products may need more promotion
- What to restock or bundle together
🧠 Use it to decide which products to scale, discount, feature on your homepage, or advertise more aggressively.
Summary
| Tool | What It Helps You Do |
|---|---|
| Sales Report | Understand overall store performance using key business metrics |
| Product Performance | Identify top-selling products and spot inventory trends |
| Date Filters | Analyze data for any custom period |
| Commission Insights | Know exactly how much you’re paying to the platform |
The Analytics and Insights section is your store’s decision-making engine. Use it regularly to adjust pricing, inventory, promotions, and product strategy — and to grow smarter, faster.