The Dashboard is the main control center for sellers. It gives a quick, visual summary of your store’s performance—covering revenue, orders, and product activity—so you can make informed decisions at a glance.
Quick Metrics
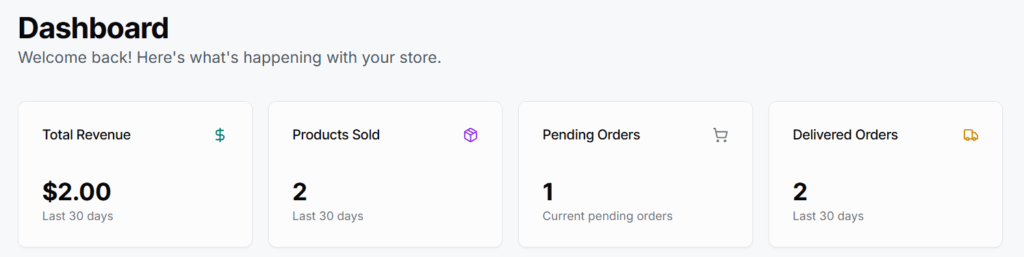
These are four cards showing essential data for the past 30 days:
- Total Revenue
- Shows the total income earned from sales.
- 💡 Helpful for tracking monthly earning performance.
- 🧪 Example: “$2.00 in the last 30 days”
- Products Sold
- Displays the number of units sold in the past month.
- Useful to identify product movement trends.
- Pending Orders
- Number of customer orders that haven’t been processed or delivered yet.
- 🔔 Keep an eye on this to avoid delays.
- Delivered Orders
- Shows how many orders have been successfully completed.
- 💡 Useful for fulfillment performance.
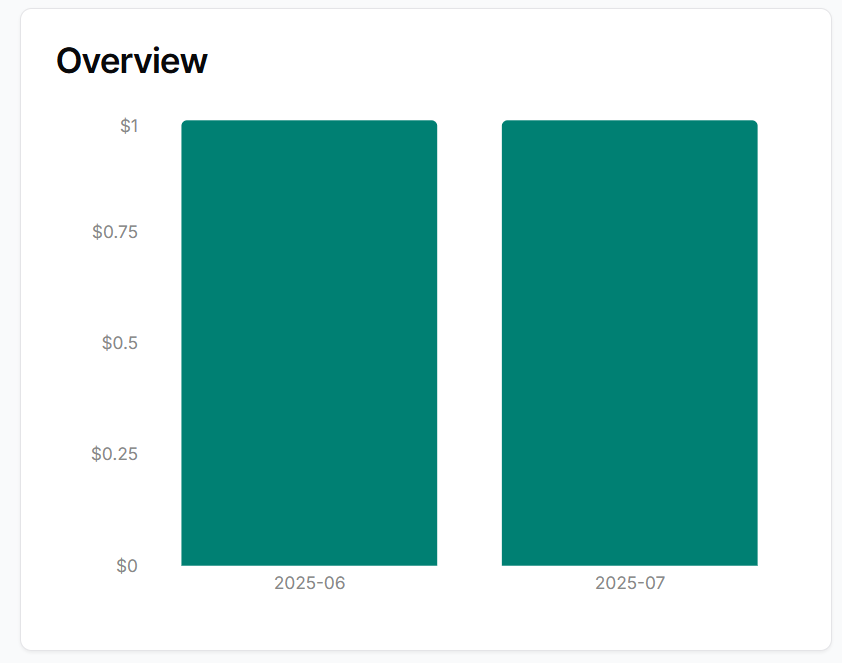
Overview
A graphical chart that visually shows:
Daily or weekly sales performance
Revenue or order volume trends
📈 Helps you quickly spot dips or growth areas.
Recent Sales
A list or table of recently sold products.
Each row usually shows:
- Product name
- Date sold
- Quantity
- (Optionally) customer details
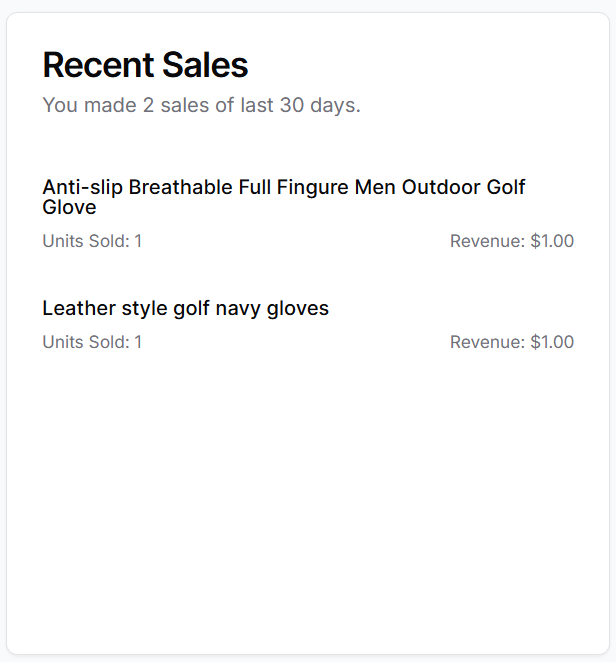
🧩 Why it’s useful:
See what’s currently selling, identify fast-moving products, and track demand patterns.
Seller Tips
- No manual action is needed—this page is informational only.
- Use it to monitor trends, prepare for restocks, or get a quick overview of order load.
- For managing orders or products, use the sidebar tabs.